
Every shopper interaction across every experience and channel becomes one thing: a better decision for next week. Not reports to interpret, recommendations to act on.
You’re the one who has to call the next move. Instead you’re staring at last week’s numbers, in a spreadsheet nobody fully trusts, trying to guess what they mean for Monday.
Results land when the next cycle is already in production. The learning never makes it into the work.
Charts without recommendations push the hardest question, what to do next, back onto the team.
Is 2% good? Against what? Without category benchmarks, every metric is an opinion.
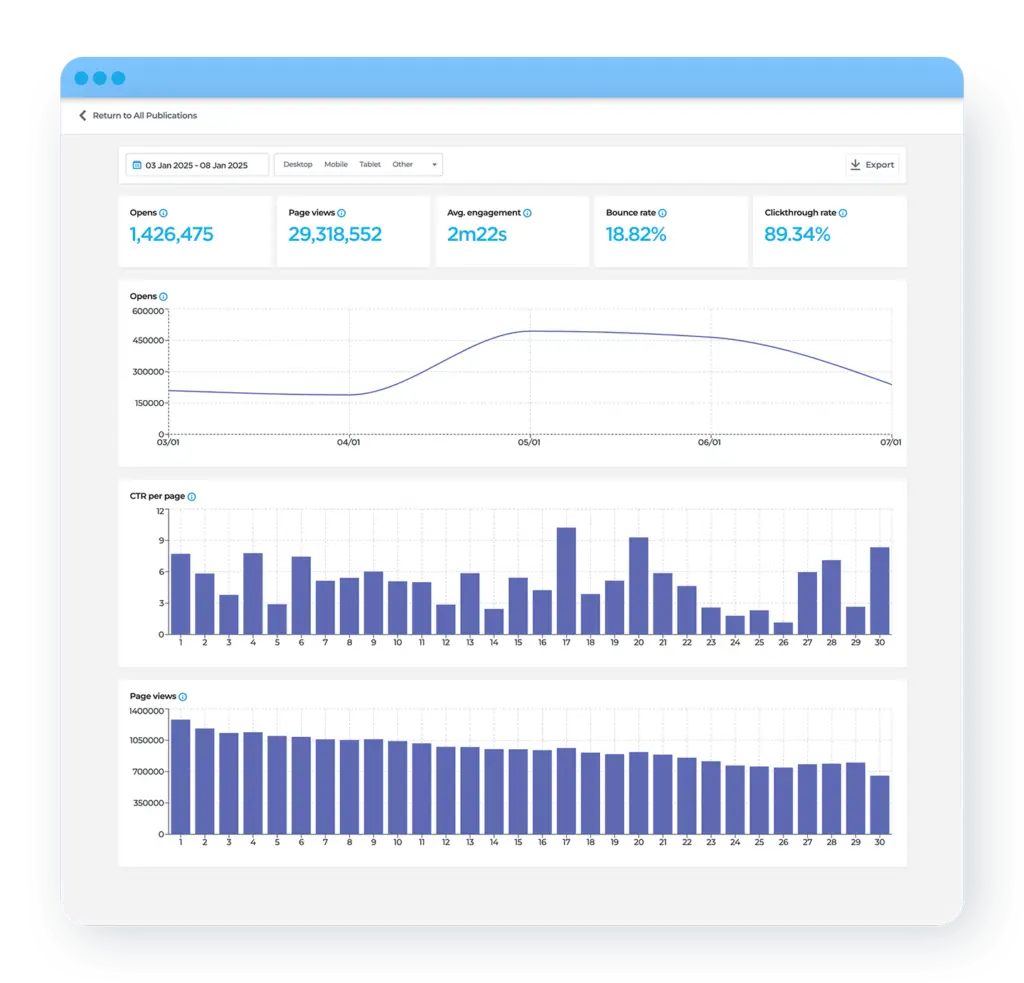
Intelligence is the engine made visible: measurement down to the item, recommendations in plain language, and benchmarks no single retailer could build alone.
Product views, add-to-cart, time spent, and purchases, measured out of the box, down to the SKU, across every region.
Plain-language recommendations you can act on: feature this next week, drop that, move this offer forward.
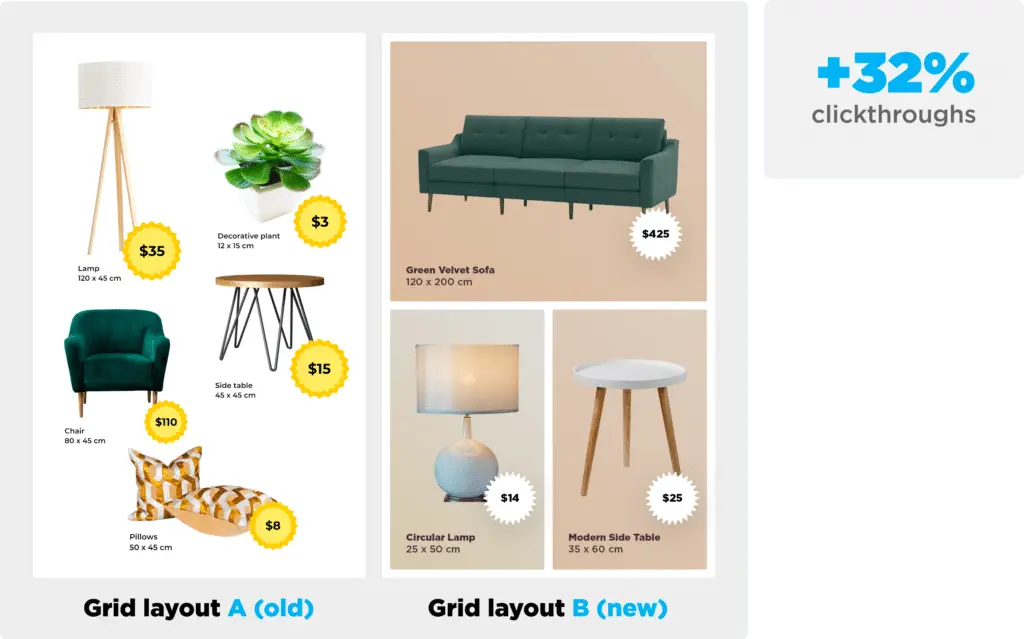
Covers, layouts, and offers tested live, with results that feed the next experience automatically.
Every retailer adds data, so your benchmarks come from 64B+ yearly product views and two decades of results, not a guess.
Market promotions and pricing pressure turned into advice: what to promote, when, and at what price.
The same data that drives next week’s plan picks what each shopper sees right now, live, not just in a report.
Click-through uplift from A/B-tested covers and layouts. (Gall & Gall)
Increase in session duration after data-driven optimization.
More wishlist adds, turning browsing into intent.
Every cycle’s results don’t just get reported, they get used: what to feature, where to place it, what to charge, and what to try next. Each decision feeds the next experience, so your starting line moves forward every time. The longer the loop runs, the further ahead you get.