When launching a digital catalog or publication, retailers and businesses generally create the design with a brand-first approach, using style guides and adhering to their usual look and feel to ensure the continuity of their brand recognition. Although brand continuity is vital, it is also essential to consider what customers want by analyzing how they interact with the publication. These interactions provide insight into the publication’s effectiveness, which you can use to improve the design.
We have created a guide on how to use your digital catalog data to design with a customer-first approach. Reviewing publication data and identifying opportunities for improvement will ultimately result in the growth of all key metrics, and this guide helps you get started.
Learn how to create benchmarks, develop and run a/b tests, and what data you should focus on to unlock valuable insights and optimize your digital publications for better engagement, higher conversions, and increased revenue.

Types of Publitas data sources used to track performance metrics
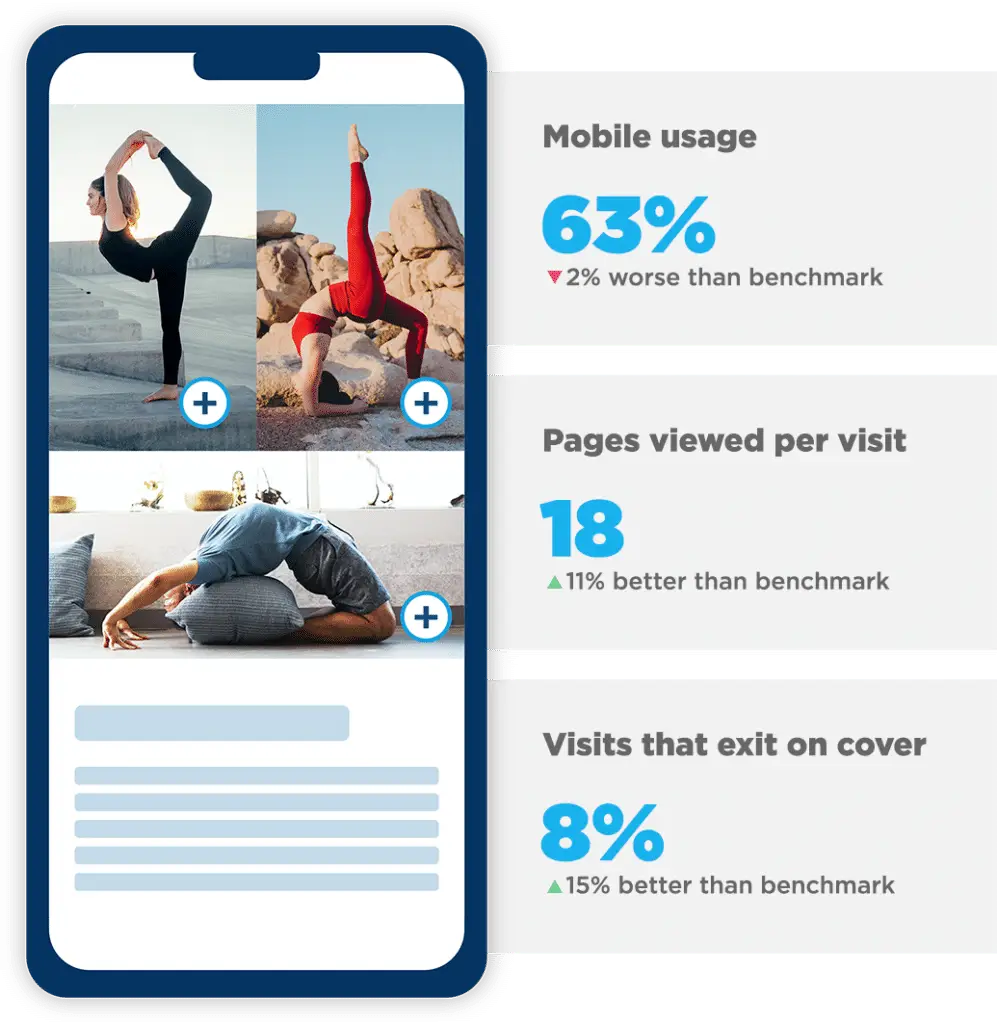
1. Benchmark data – Industry and past performance
Before exploring the specifics of data sources, it’s essential to understand the role of benchmarks. Benchmarks provide a reference point against which you can measure your performance. By comparing your metrics to market competitors, industry standards, or past performance, you can see where you outperform, identify areas for improvement, and set realistic goals.
The key metrics to set up tracking for and focus on from day one are:
- Impressions
- Clicks
- Click-through rate
- Bounce rate
- Conversions/purchases
- Conversion rate
- Average order value (AOV)
- Return on investment (ROI)
- Customer Acquisition Costs (CAC)
- Customer lifetime value
- Shopping cart abandonment rate
- Returning customer rate
Each metric tells you a different thing based on the performance you are seeing. For example, a high bounce rate could mean the page is slow to load or the information isn’t what the viewer wants.

2. Third-party platform data – Affiliates, e-commerce platforms and more
Data from various platforms, such as Shopify, Folders.nl, Promobutler, Stocard, Klarna, and other affiliate networks, offer insights into your publication’s reach and effectiveness. These platforms track user interactions, click-through rates, and conversion rates, providing a comprehensive view of your content’s performance across different channels.
3. Digital publication dashboard data
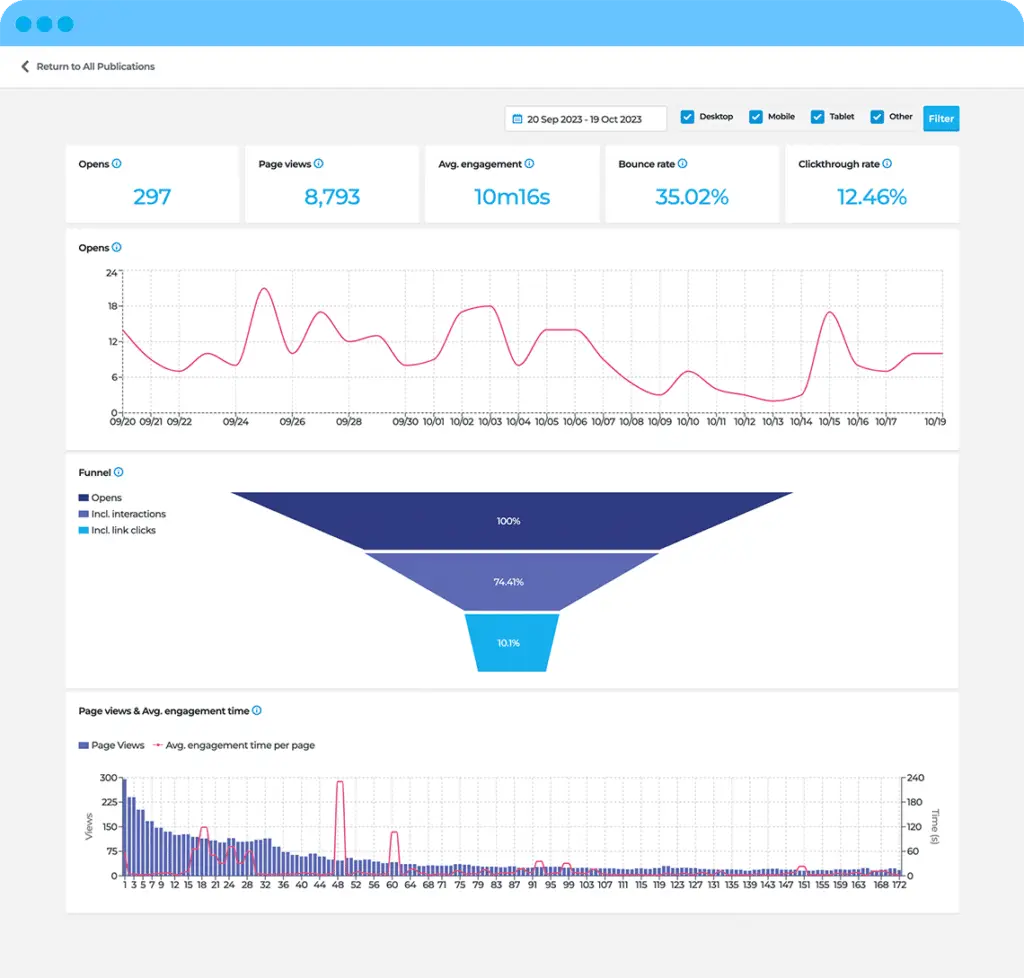
Your digital publication dashboard is a goldmine of information. It consolidates data from various sources, offering a centralized view of performance metrics such as page views, time spent on a page, click-throughs, bounce rates, and more. This data is crucial for understanding how users engage with your content and where improvements can be made.

4. GA4 integration
Integrating your digital catalog with Google Analytics 4 (GA4) allows you to track and analyze data from your digital catalog alongside other website data. This provides you with a holistic view of your online performance and empowers you to make data-driven decisions that optimize your catalog’s performance.
The process of tracking performance metrics
1. Setting a baseline for measurement
The first step in leveraging performance metrics is establishing a baseline or 0-measurement. This involves collecting data on your current performance across various metrics. This baseline is a reference point for all future measurements and comparisons.
2. Benchmarking with industry
Comparing your performance against industry benchmarks is a critical step. Industry benchmarks provide a context for your data, helping you understand where you stand relative to your competitors. For more detailed information on benchmarking, check out our benchmark blog.
3. Set performance improvement roadmap with goals and KPIs
Once you have your baseline and industry benchmarks, it’s time to set a performance improvement roadmap. This roadmap should include specific goals and Key Performance Indicators (KPIs) that align with your overall business objectives. By setting clear, measurable goals, you can track your progress and make data-driven decisions.
A phased approach to improving performance
Implementing changes all at once can be overwhelming and counterproductive. Instead, adopt a phased approach to integrating new strategies and measuring their impact gradually. Each phase should involve monitoring data, comparing it with the 0-measurement, and adjusting the roadmap as needed. A frequently used recommendation is to run A/B tests during each phase to gain a deeper understanding of your audience and gather the required insights to make data-driven decisions over gut feeling.
Phase 1 – A/B testing optimizations and features
Start by introducing new templates to your digital publications. Well-designed templates can enhance your content’s visual appeal and readability, improving user engagement.
- Add Functionalities (GIFs, Video, Design Elements): Incorporate multimedia elements such as GIFs, videos, and other design enhancements. These elements can make your content more dynamic and engaging, capturing your audience’s attention.
- Gather Insights in Your Reach: Analyze your content’s reach by tracking metrics such as page views, shares, and social media interactions. Understanding how far your content travels can help you refine your distribution strategies.
- A/B test: Conduct A/B testing to compare different versions of your content. This testing method allows you to identify and learn which elements resonate best with your audience, enabling you to optimize your content for better performance. You can either conduct a/b tests yourself or have a Publitas consultant work with your team to set up highly controlled scientific tests based on their previous experience of successful a/b tests. A/B tests could be conducted in the following areas of the catalog:
- Pricing sizing, location, color
- Grid layout, spacing, color
- Background color, font color
- Font sizes/types
- Call outs
- Product order/description
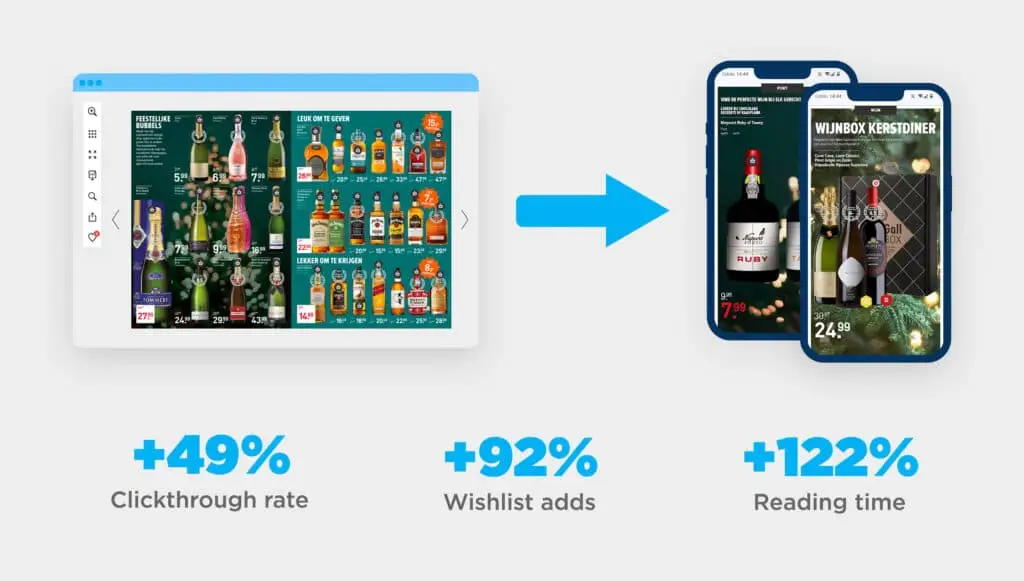
Publitas helped Dutch liquor store retailer Gall & Gall optimize their mobile catalog to increase conversion and engagement. We ran several A/B tests to improve the mobile design. Here are the results:

Phase 2 – Add dynamic content
Introduce dynamic content that adapts to user behavior and preferences. This can include personalized recommendations, real-time updates, and interactive elements that enhance user engagement.
- Add Feed Integration: Integrate various feeds, such as social media, news, quizzes, or product feeds, into your digital publications.
Integrating feeds, especially first-party feeds, creates the opportunity for added relevancy for customers. For example, by adding quizzes or forms to your catalog/website that ask questions such as ‘Do you prefer vegan, meat, fish?’ you can learn about your customers and show them products in the future that they are more likely to purchase. This integration also ensures your content remains fresh and relevant, providing additional value to your audience.
- Add Shopping Integration: Incorporate shopping features directly into your digital publications. By enabling users to purchase without leaving your content, you can increase conversions and drive revenue by reducing friction in the shopper journey.
Phase 3 – Add personalization (through DMP/CMP data)
To personalize your content, utilize Data Management Platforms (DMP), Customer Management Platforms (CMP), or loyalty program data. Personalization can significantly enhance user experience by delivering content tailored to individual preferences and behaviors.
- Add relevance (based on weather or trend data and historical purchases): Enhance the relevance of your content by leveraging external data sources such as weather conditions, current trends, and historical purchase data. This approach ensures that your content remains timely and contextually appropriate.
- Trade & Supplier Income (Selling Top Positions CPM): Monetize your digital publications by selling prime advertising positions on a Cost Per Mille (CPM) basis. Partnering with trade and suppliers can generate additional income while providing them with valuable exposure.
The next step in leveraging catalog data
Leveraging performance metrics from your digital publication data is a powerful strategy for achieving enhanced results. By systematically analyzing data from various sources, establishing benchmarks, and implementing a phased approach, you can continuously improve your content and drive better engagement, conversions, and revenue.
Remember, the key to success lies in regularly monitoring your performance, conducting A/B tests, and adjusting your strategies based on the insights gained from your metrics. Using your data to enhance your publications’ performance is not something you need to do on your own. Our experienced team of experts can work with you to create a robust tracking and testing structure.


