Important notice: This blog post contains outdated information. You can find the latest on measuring your Publitas publications here.
Understanding how shoppers use your online catalogs can be difficult, and the default reports in Google Analytics (GA) don’t always give you the statistics you need. In this post, we’ll explain how you can set up GA to retrieve useful statistics for your catalogs.
We’ll also provide a ready-to-use custom dashboard that includes the most important key performance indicators (KPIs) such as pages viewed per session (exposure) and number of products clicked. This way, you can quickly and easily find out how your catalogs are performing.
Contents of this post:
- Connecting your Publitas account to Google Analytics
- Adding a ready-to-use Publitas dashboard to your Google Analytics account
- Using segments to view statistics for a single catalog
- Adding multiple segments to compare catalogs
1. Connecting your Publitas account to Google Analytics
Before you can see your catalog’s statistics in GA, you’ll have to make sure you’re logging data from Publitas to GA. Luckily, that’s easy to set up:
- Set up a GA property.*
- Paste the Tracking Id from your GA property into your Publitas account (Analytics -> Google Analytics Tracking ID).
* In step eight of setting up a GA property, use https://view.publitas.com as your Web Site URL.
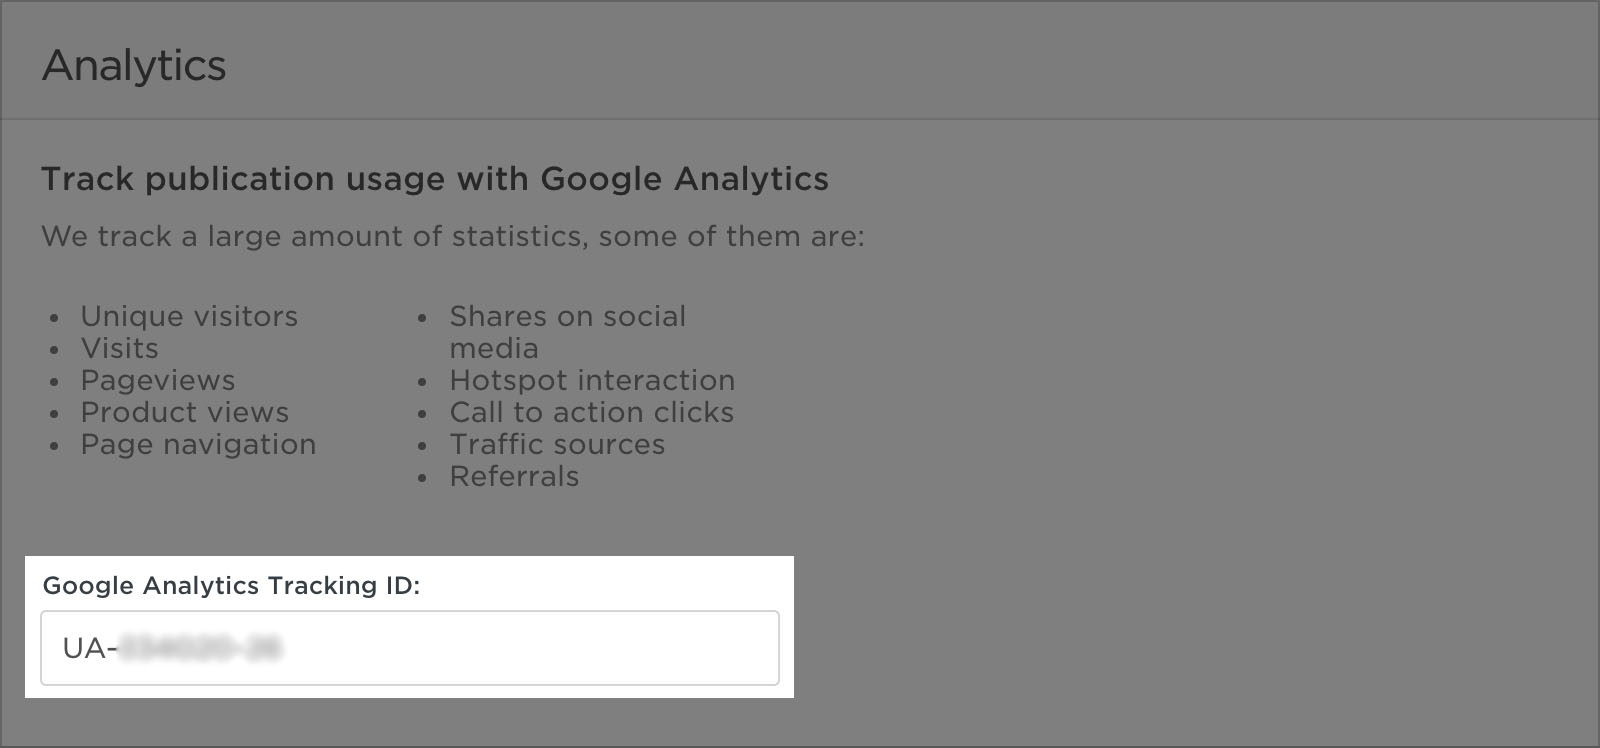
With that set up, statistics will start to appear in your GA account after roughly two days.
What do we track with Google Analytics?
Some of the statistics we track are:
- Unique visitors
- Visits
- Pageviews
- Product views
- Page navigation
- Shares on social media
- Hotspot interaction
- Call to action clicks
- Traffic sources
- Referrals
And while we track much more than that, we’ve noticed that many of our customers prefer a simple-to-use dashboard that only provides the most relevant data. Let’s see how we can set that up.
2. Adding a ready-to-use Publitas dashboard to your Google Analytics account
With GA, custom dashboards are easy to create. And even better, dashboard configurations are shareable amongst users. So, we’ve created two custom dashboards with the most commonly requested catalog statistics and KPIs.
To add a dashboard to your GA account, simply click on one of the links below and then select the view where you track your catalogs. The dashboards work for any catalogs published with Publitas and need no further implementation.
- Publitas product dashboard (for users that use product hotspots): https://support.publitas.com/publication-analytics
- Publitas simple dashboard (for users that don’t use product hotspots): https://support.publitas.com/publication-analytics
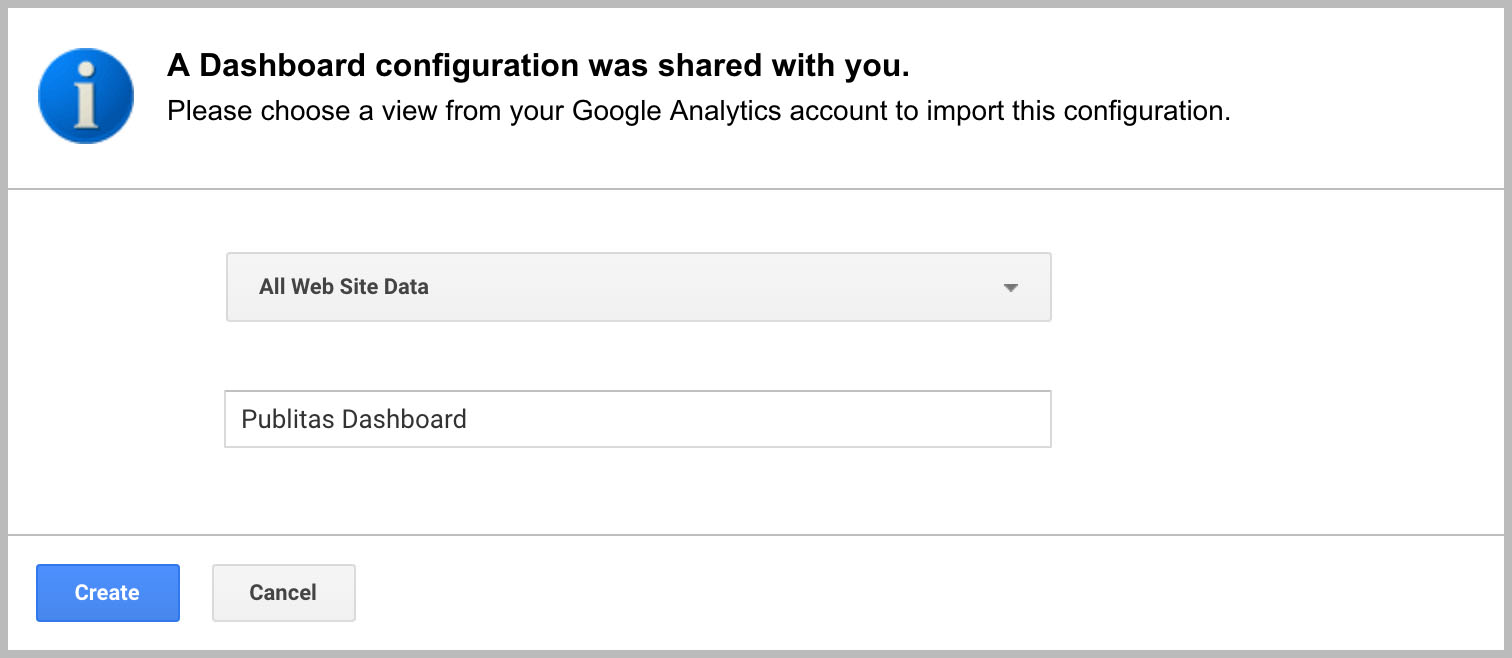
You can find your newly added dashboard in GA under Customization -> Dashboards. Note that no data will be shared with you or others. You’re only importing the configuration of the dashboard, which then uses the data from your catalogs.
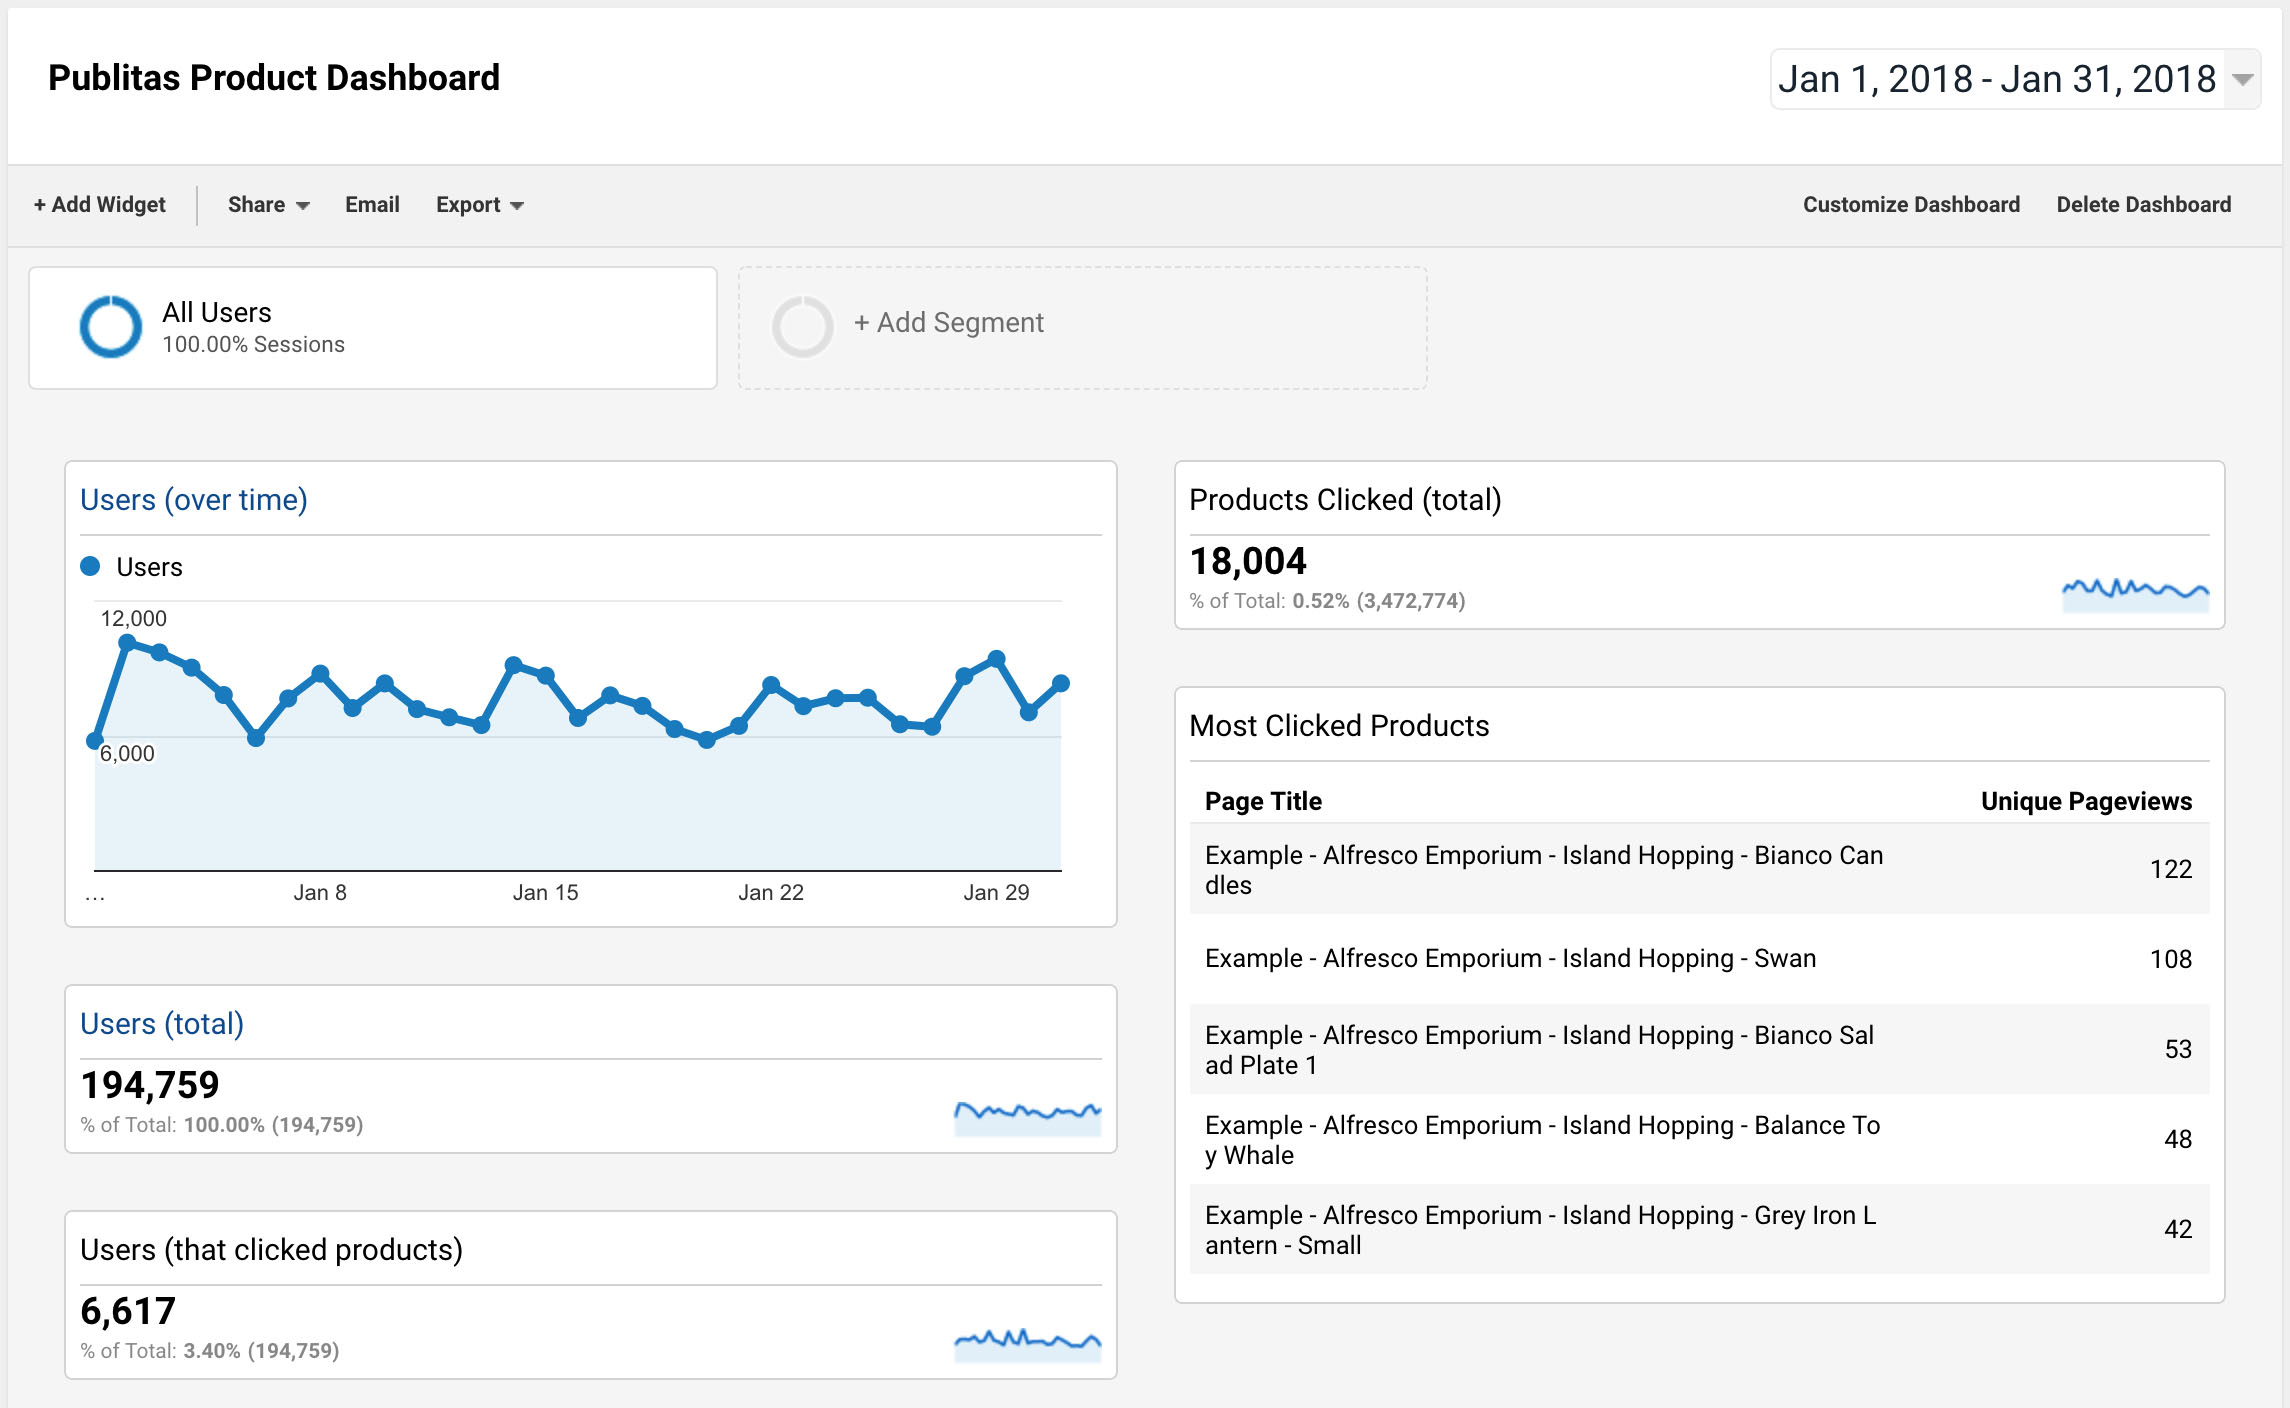
What do we report in the custom dashboards?
Available in both dashboards:
- Pages/Spreads per Session: Average # of pages or spreads viewed per session. (Pages for single page view, and spreads for booklet view);
- Avg. Session Duration: Average duration of a session;
- Users (that clicked links): # of users that clicked at least one link hotspot (or a link inside a product hotspot);
- Sessions by Device Category: # of sessions, divided in three categories: desktop, mobile and tablet.
Available in product dashboard only:
- Users (total): # of users;
- Users (over time): # of users per day;
- Most Clicked Products: # of clicks for the top 5 most clicked product hotspots;
- Most Clicked Links (PRODUCT hotspots): # of clicks to your online store for the top 5 most clicked links inside product hotspots;
- Products Clicked (total): Total # of product hotspot clicks;
- Most Clicked Links (LINK hotspots): # of clicks for the top 5 most clicked link hotspots;
- Links Clicked: Total # of link clicks, including link hotspots and links inside a product hotspot.
Available in simple dashboard only:
- Sessions (total): # of sessions;
- Sessions (over time): # of sessions per day;
- Top 5 Most Clicked Links: # of clicks for the top 5 most clicked link hotspots;
- Links Clicked (total): Total # of clicks on link hotspots.
With either one of these dashboards you’ll get a nice overview on how your catalogs are performing. In the next step, we’ll take a look at how you can view the statistics for a single catalog.
3. Using segments to view statistics for a single catalog
In some cases, you might want to see statistics for a single catalog rather than all your catalogs combined. For example, if you wish to understand how a specific catalog or campaign is performing.
The best way to do so in GA is by using segments. A segment allows you to filter statistics while displaying them in the same dashboard.
Here’s how you can create a segment for a single catalog:
-
- Click ‘+ Add Segment’;

-
- Then, click ‘+ NEW SEGMENT’;

-
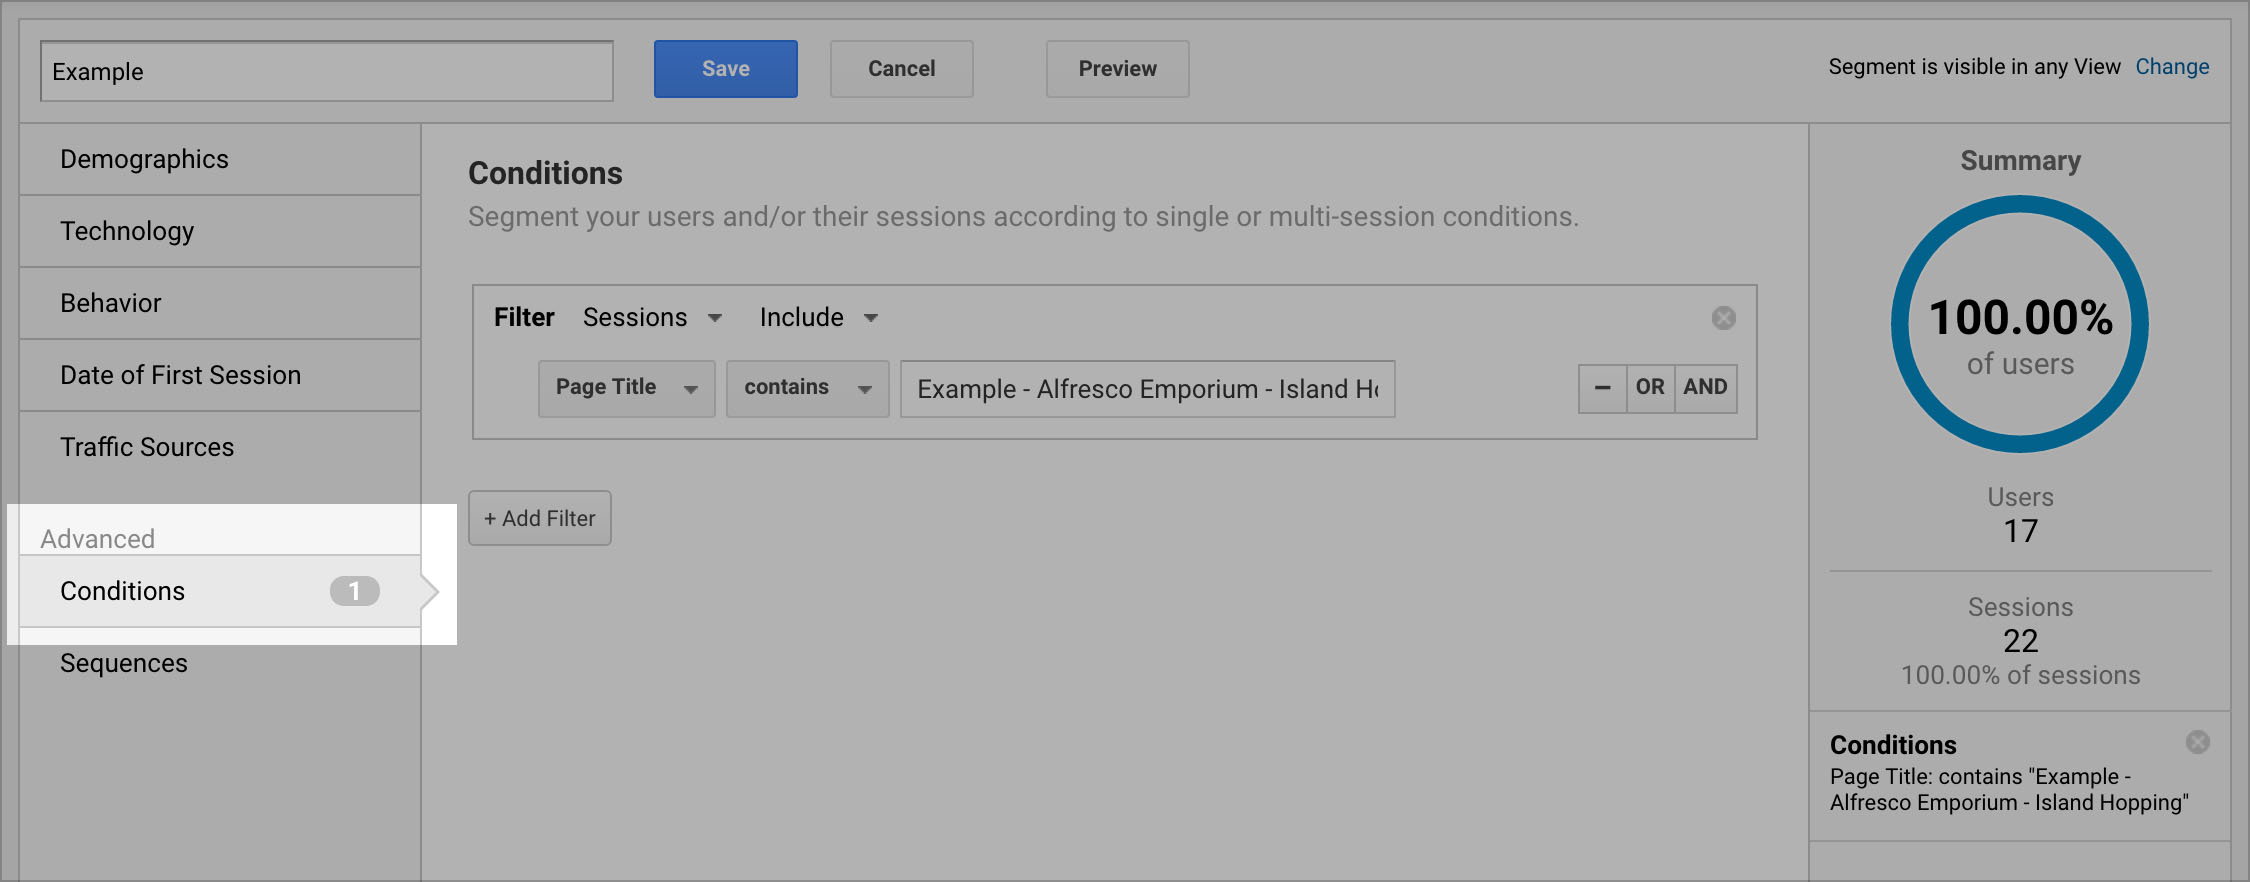
- Name the segment, then go to the tab Advanced -> Conditions;
-
- Here you’ll want to create a filter that includes sessions from a catalog based on its browser title. Select ‘Sessions’, ‘Include’, ‘Page Title’ and ‘Contains’. Then, supply the title for the catalog you’d like to review*;

- Click Save.
* When entering a catalog title, GA might show suggestions as you start typing. These suggestions often include page numbers. If you wish to create a segment for the entire catalog, you should leave those page numbers out! For example, have a look at this suggested title from Google. The page numbers that need to be removed are indicated in red:
“Example – Alfresco Emporium – Island Hopping – Page 16-17”
Also, since we’re using the catalog’s browser title to create a segment, you should avoid changing the browser title once a catalog is published. If you do change your catalog’s browser title, you’ll need to expand your segment with a second filter to support the new changes.
The browser title of a catalog can be affected in Publitas by changing the group name, the catalog name or entering a custom browser title at “Settings”.
4. Adding multiple segments to compare catalogs
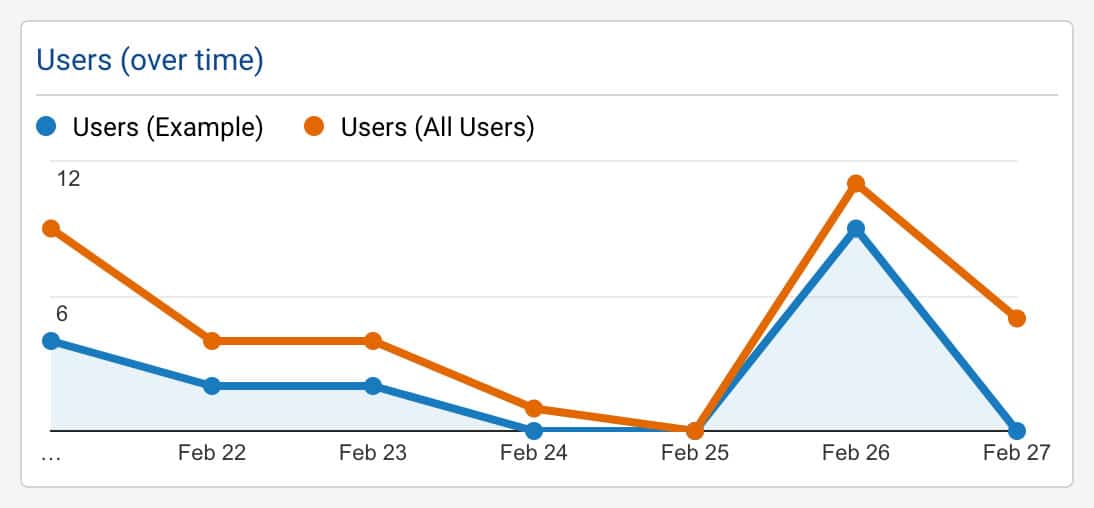
Catalog comparison is one way to gain more insight on how your catalogs are performing. In GA this is very easy to do, as you can add multiple segments to your current view.
Simply click “+ Add Segment” and select the segments you’d like to compare.

Here’s how a comparison looks with two active segments:
Start measuring and improve your catalogs
That’s it. Armed with segments and a dashboard, you can start to measure how your catalogs are performing. And by focusing on the KPIs, it’ll be easier to improve your catalogs.

